



Getting started
Open the Playground to start drawing in Wirepaint. A drawing is made by a graph: nodes that compute values (numbers, points, shapes…), connected by wires. Whatever reaches the Output node is drawn.
The Playground needs a mouse and keyboard: touch screens aren't supported.
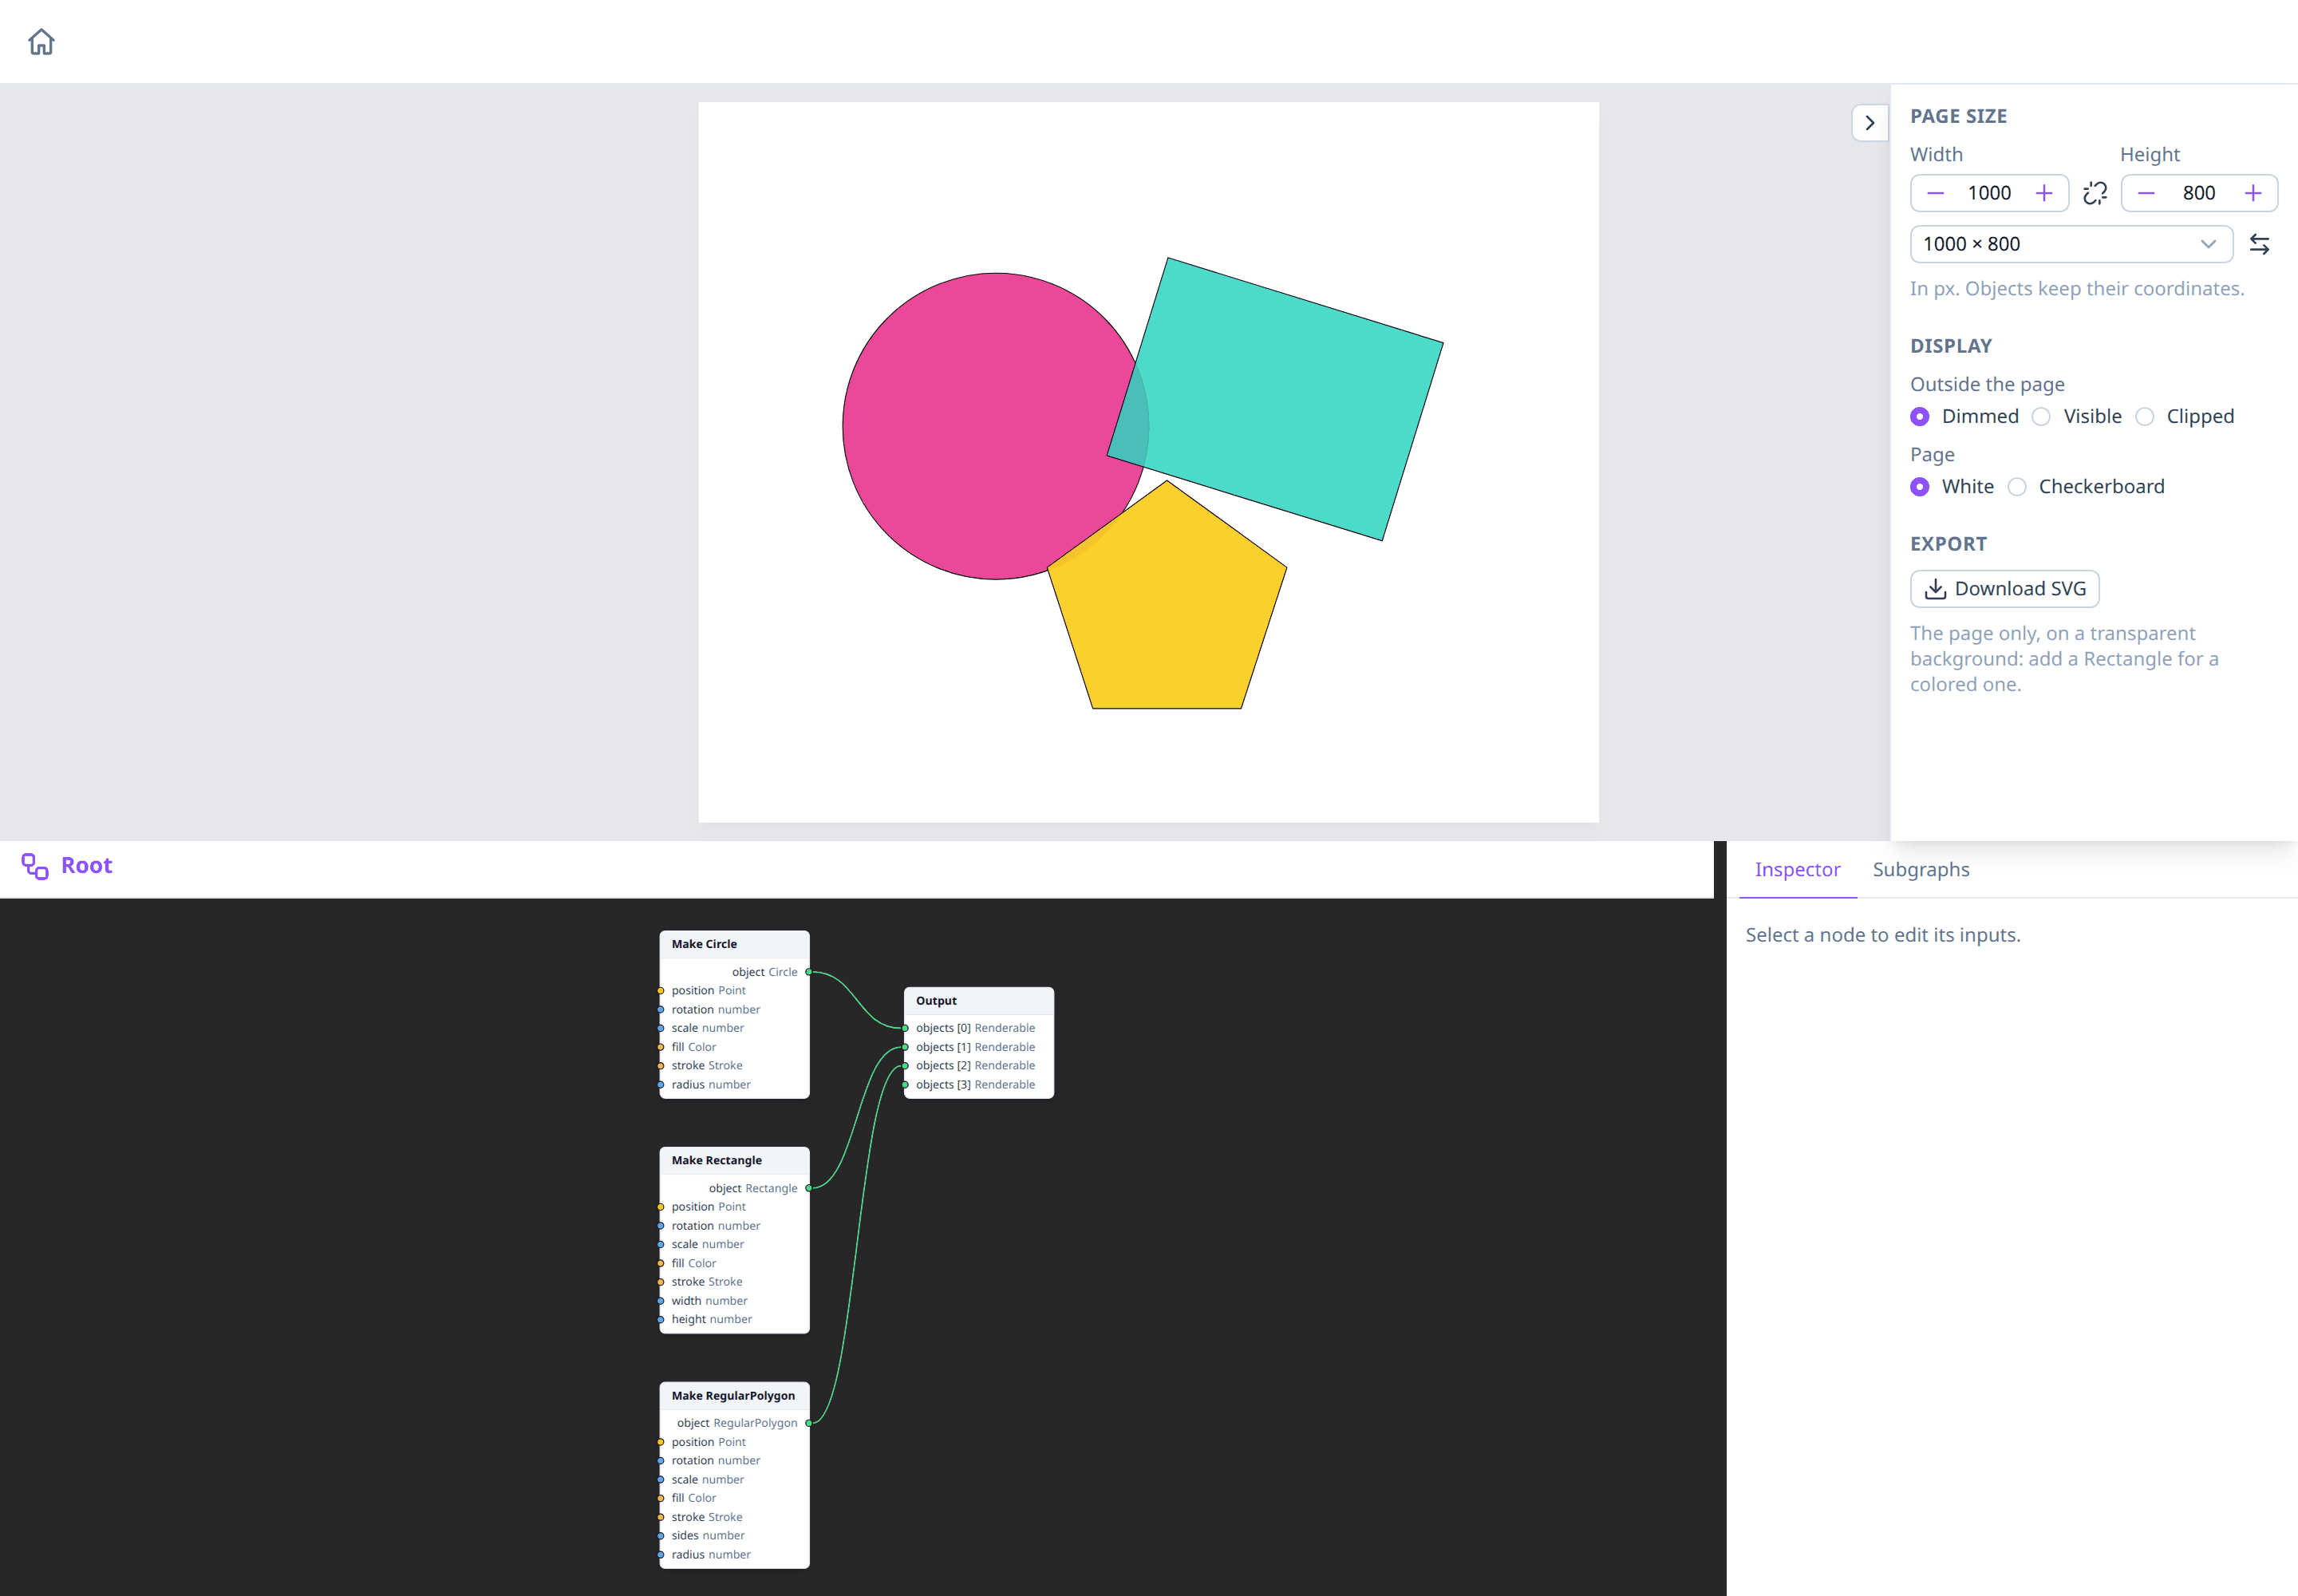
The Playground has three areas.
The image area
The top half shows the drawing on its page, and updates as soon as the graph changes. Drag to pan and scroll to zoom. The Image drawer on its right edge sets the page size (1000 × 800 by default), how the preview shows what lies outside the page, and downloads the image as SVG; see Live preview.
The graph editor
The bottom left is where the graph is built: add nodes, connect their pins with wires, and connect the shapes to draw to the Output node. Every new graph starts with the Output node, which can't be deleted. See Navigating the editor, Adding nodes and Connecting pins.
The property inspector
The bottom right shows the inputs of the selected node, in its Inspector tab. Inputs that aren't connected to a wire can be edited there; see Property inspector. The Subgraphs tab next to it lists your subgraphs; see Subgraphs.
Drag the divider between the graph editor and the inspector to resize them. The browser remembers the sizes.
Saving your work
The Playground doesn't save on its own. Use File → Save (Ctrl+S) to download the drawing as a file, and File → Open… (Ctrl+O) to open it again; File → New starts over. See Saving and opening.
Made a mistake? Ctrl+Z (⌘Z on macOS) undoes the last change, and Ctrl+Shift+Z redoes it; the Edit menu has both. See Undo and redo.
A first drawing
- Move the pointer over the graph editor and press Shift+A.
- Type
make circleand press Enter: a Make Circle node appears. - Drag from its
objectpin (on the right) to the Output node'sobjectspin (on the left). A gray circle appears in the page's top-left corner: its position is (0, 0) until you change it. - With the Make Circle node selected, change its
radiusorfillin the inspector.
See also
- Saving and opening: keeping your drawings in files.
- Dataflow and the Output node: how a graph becomes a drawing.
- Nodes: every node, with its pins.
- Types: what each pin type holds.