



Triangles on a grid
Sixty-three triangles on a grid, each turned a little more than the one before. The grid gives the points; Map calls a small function once per point, and the function makes the triangle. It's the "for each" of node graphs.
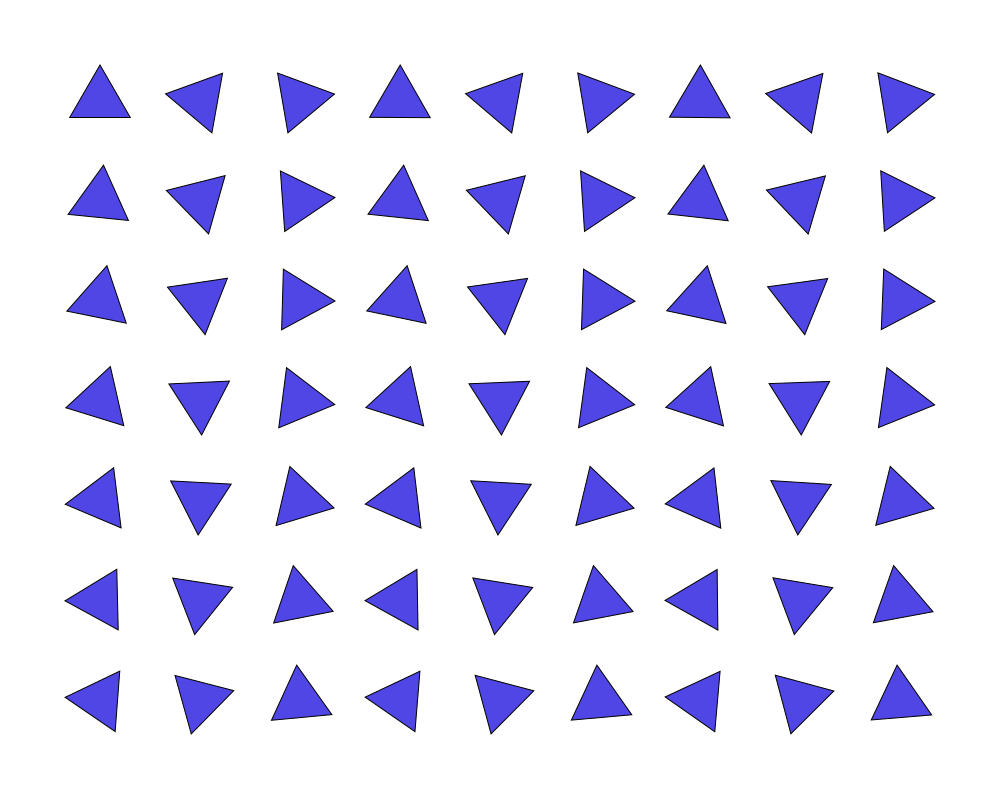 Open in Playground
You'll use: Make BoundingBox, Orthogonal Grid, Map, a function made with New function… (Graph Input, Multiply, Make RegularPolygon, Graph Output), Output.
Steps
1. The grid
Add a Make BoundingBox node (Objects → BoundingBox → Make BoundingBox) and set:
topLeft: x 100, y 100;bottomRight: x 900, y 700.
Add an Orthogonal Grid node (Lattice) and connect the box's object
to its area. Its x and y spacing stay at 100: the grid has 9 columns
of 7 points, 100 apart.
Add a Map node (Array) and connect the grid's points to its
array. Map's function input now expects a function taking a Point.
2. A new function
Drag a wire from Map's function input and drop it on empty canvas. The
menu opens with New function… first: choose it.

A function node, "Map function (function)", appears where you dropped the
wire, connected to Map, and its body opens: the breadcrumb above the
editor reads Root › Map function. The body has a Graph Input with
the params Map passes, element (a Point) and index (a number), and a
Graph Output with one result, result, a number for now.
3. The triangle
In the body:
- Add a Make RegularPolygon node (Objects → RegularPolygon) and set
sidesto 3,radiusto 35 andfillto r 79, g 70, b 229. Connect Graph Input'selementto itsposition. - Add a Multiply node (Math), connect Graph Input's
indexto itsa, setbto 0.1, and connect itsresultto the polygon'srotation. - Select Graph Output. In the inspector, change the type of
resultfrom number to RegularPolygon. Then connect the polygon'sobjecttoresult.
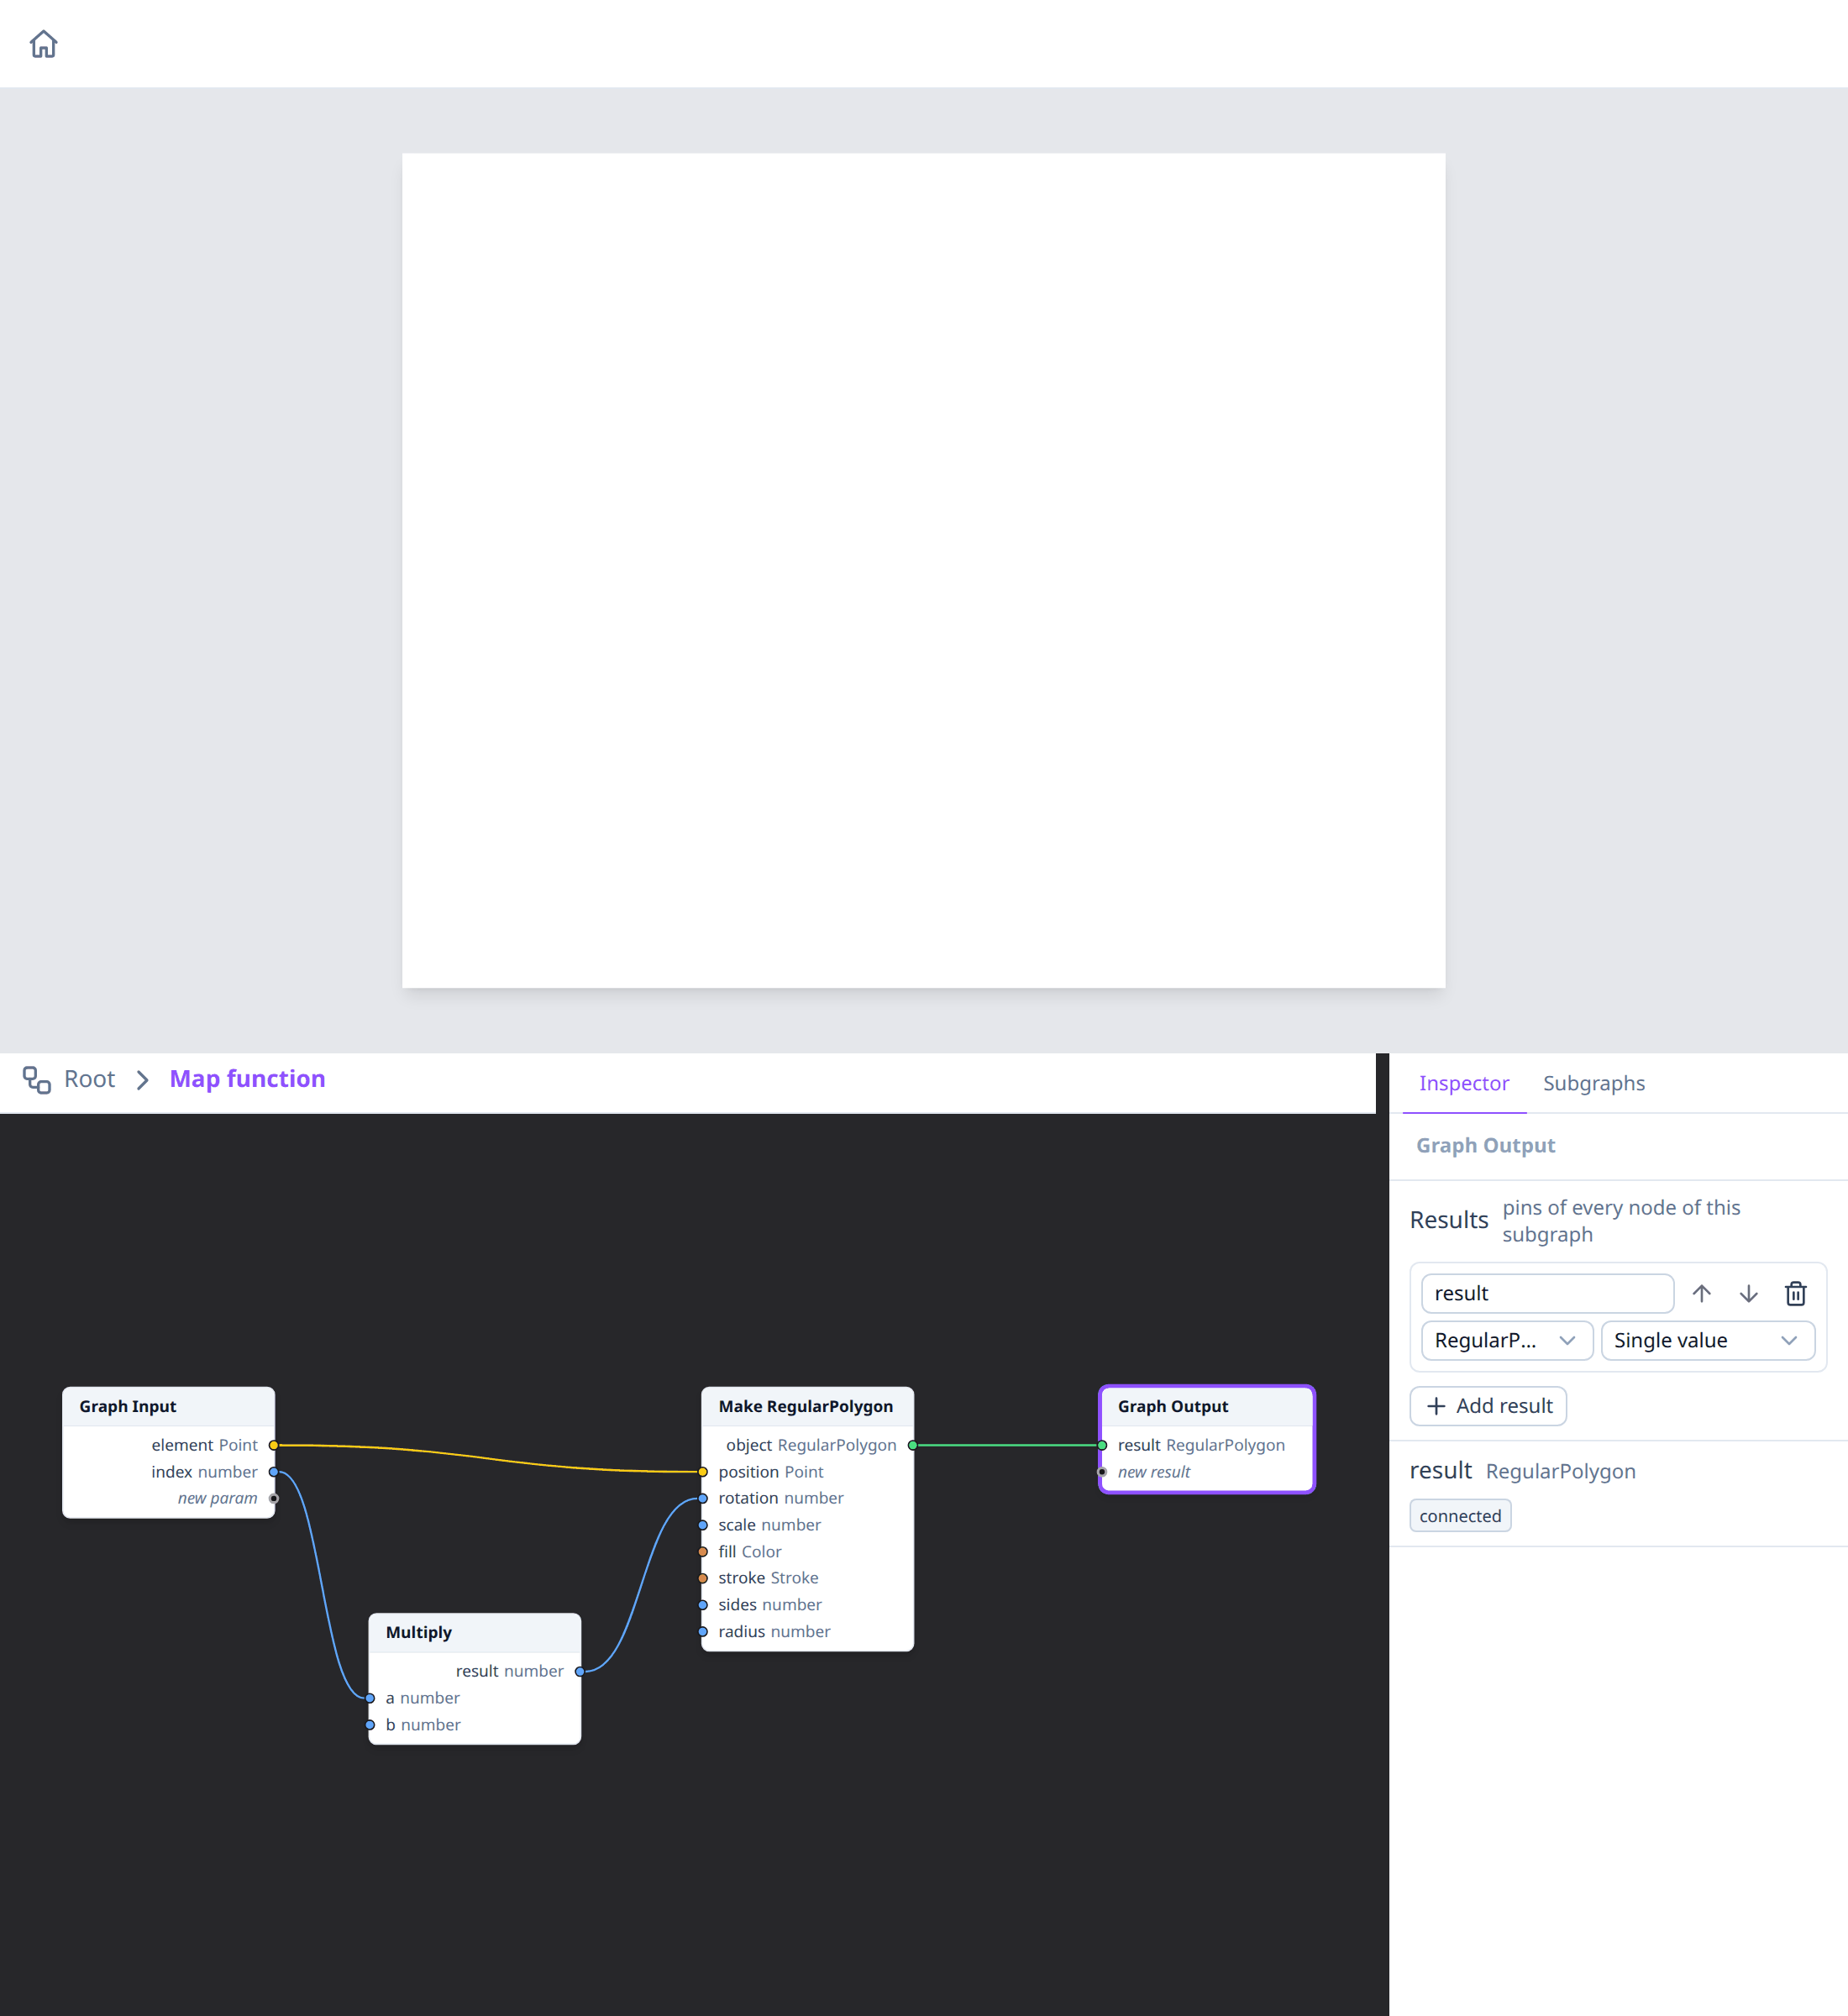
Nothing is drawn yet: Map isn't connected to the Output node.
4. Drawing them
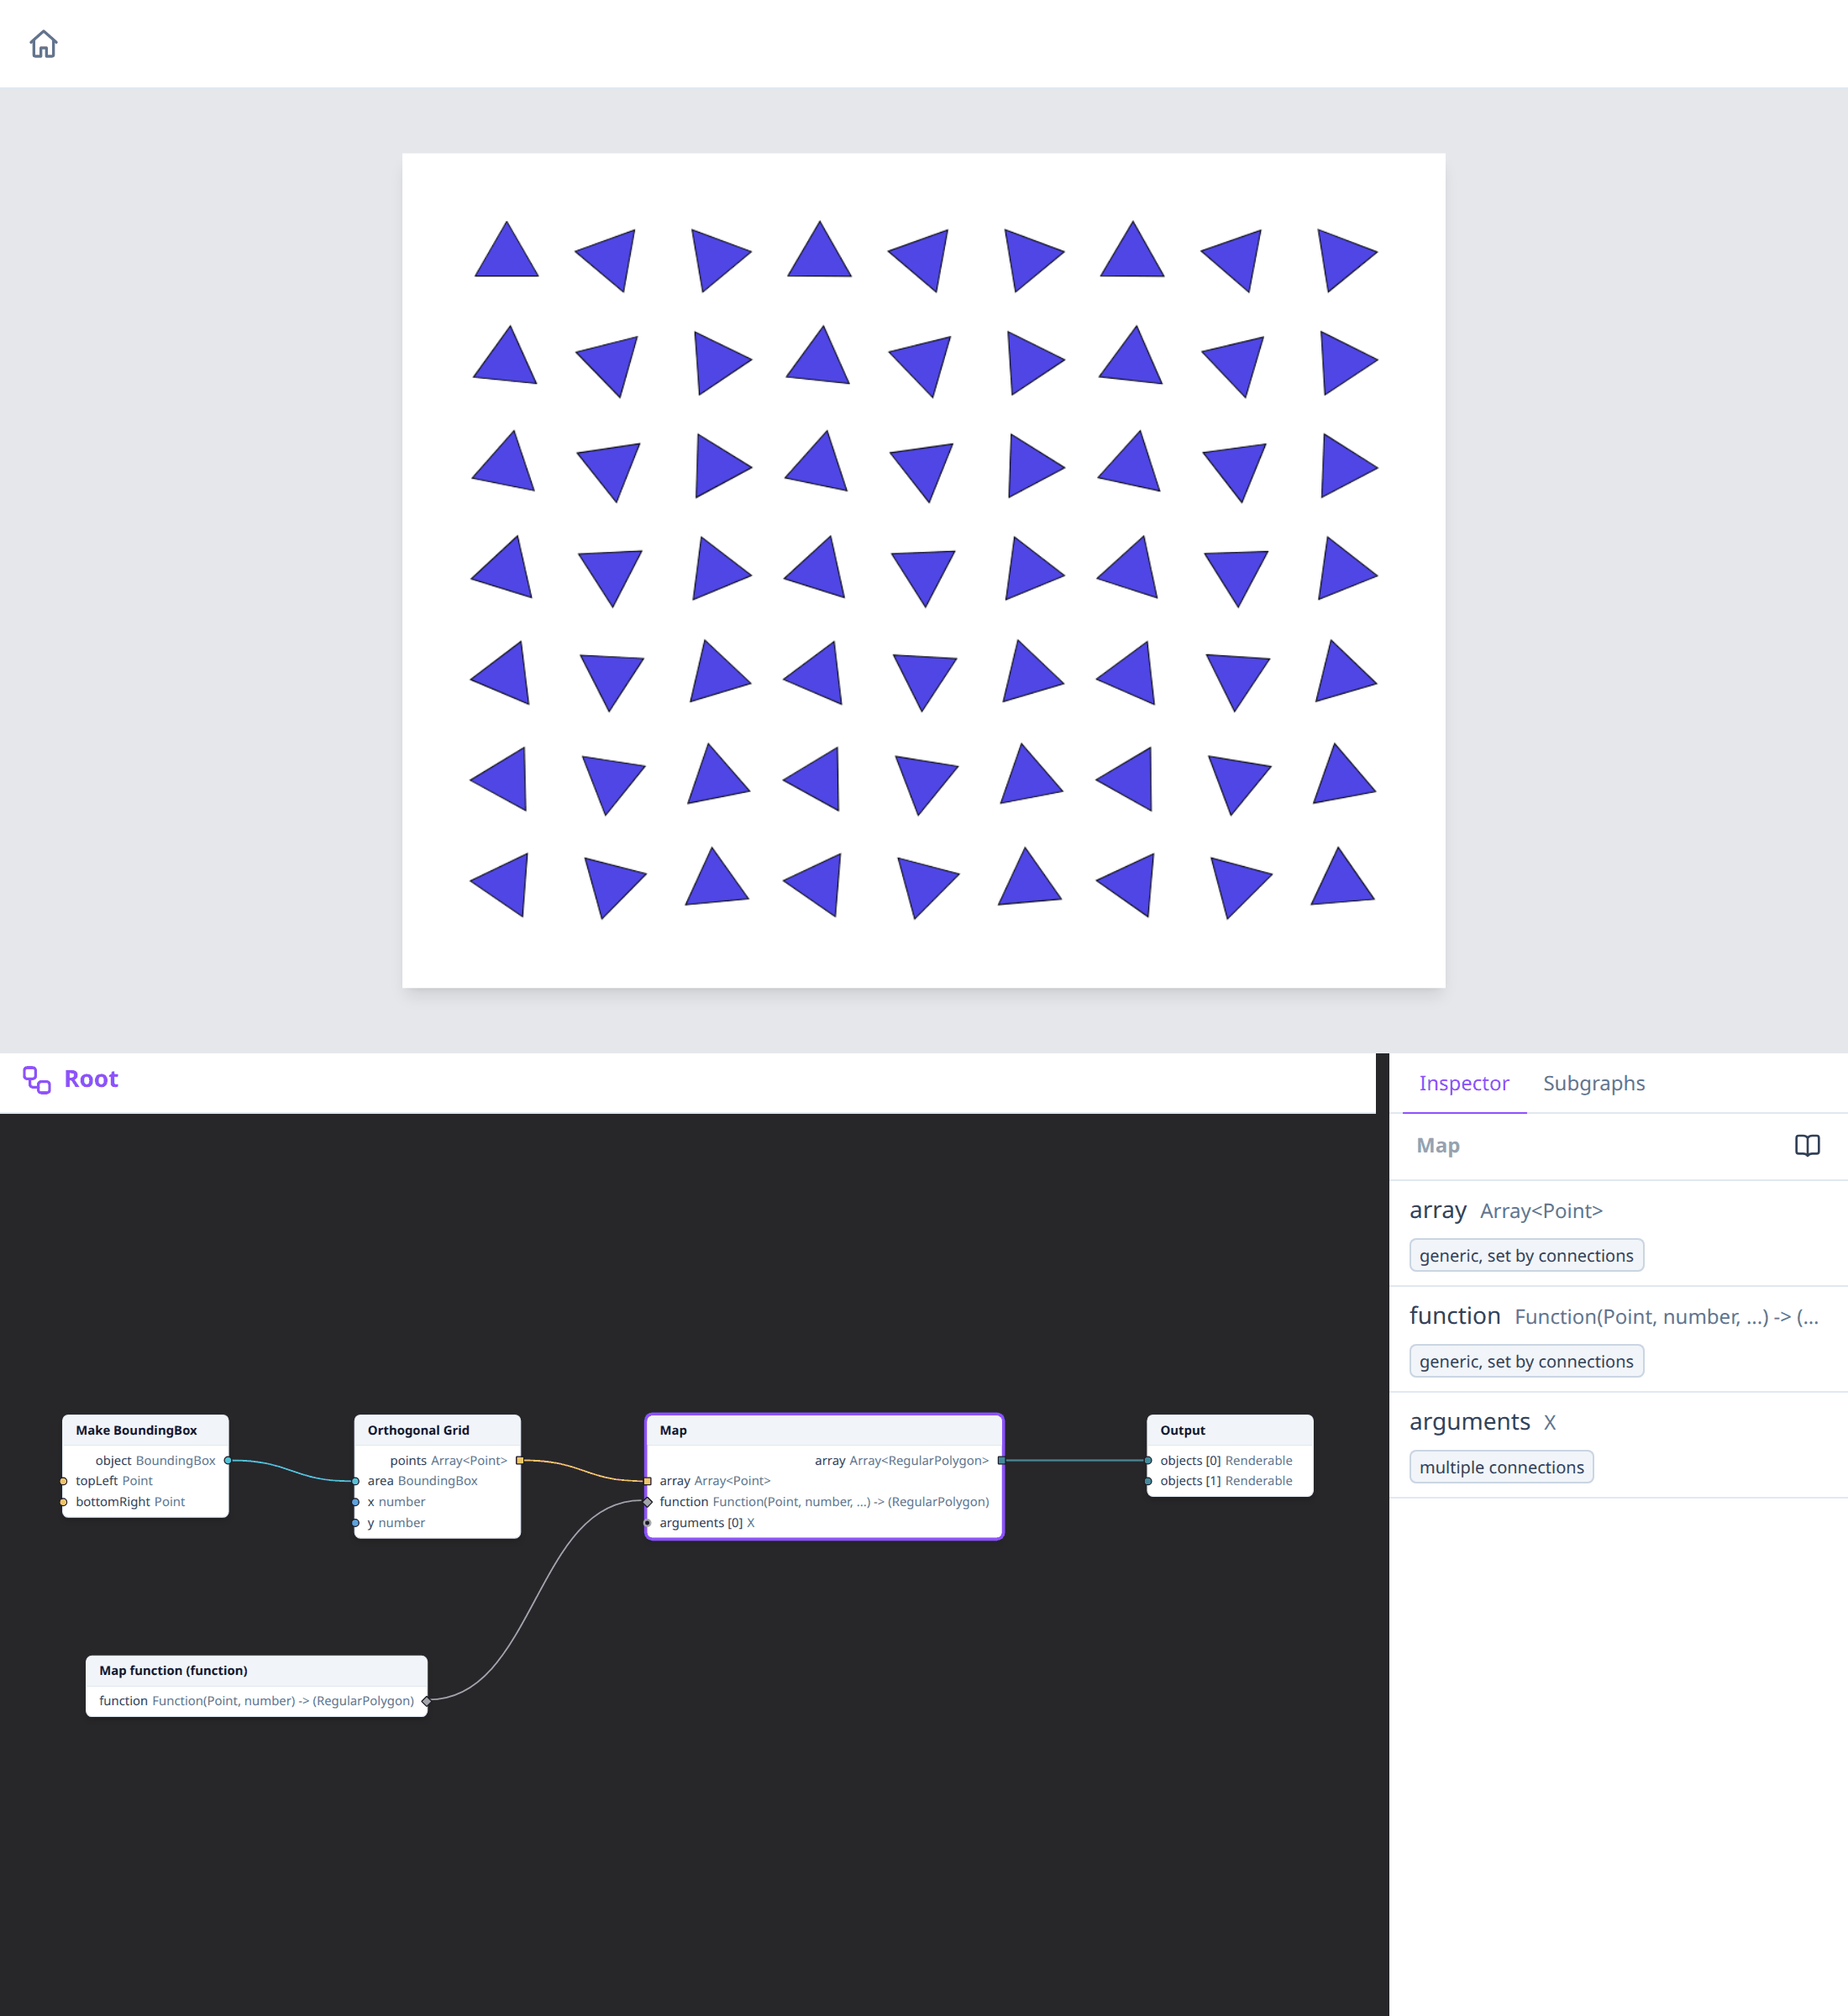
Click Root in the breadcrumb. Map's output is now an
Array<RegularPolygon>. Connect it to the Output node's objects: an
array connected there draws all its elements.
How it works
Map calls the function once for each of the grid's 63 points, with the
point as element and its position in the array as index, and collects
the 63 triangles in an array.
The grid lists its points column by column, top to bottom. So index
goes 0 to 6 down the first column, 7 to 13 down the second, and so on,
and each triangle is turned 0.1 radians more than the one above it.
The function only sees what Map passes it: it can't use the grid or other
nodes of the main graph directly. To give it more values, connect them to
Map's arguments: each one becomes another param of the function.
Nodes used
- Make BoundingBox and Make RegularPolygon, on their types' pages.
- Orthogonal Grid.
- Map.
- Multiply.
- Output.
Variations
- Random turns. Replace Multiply with a Random Number node (min 0, max 6.2832) inside the body: each call draws its own number, so every triangle gets its own angle.
- The size, set outside. Add a Number node
to the main graph, set its
valueto 20 and connect it to Map'sarguments. Map now passes a third value, so it reports an error until the function takes it: open the body, select Graph Input, click Add param and connect the new param to the polygon'sradius. (New function… adds these params by itself for arguments that are already connected.) - Other shapes. Set
sidesto 6 for hexagons, or use a Make Circle and change the result's type to Circle. - Another grid. Replace Orthogonal Grid with an Equilateral Triangle Grid.
See also
- Subgraphs: the Subgraphs tab, signatures and New function….
- Subgraphs and functions.